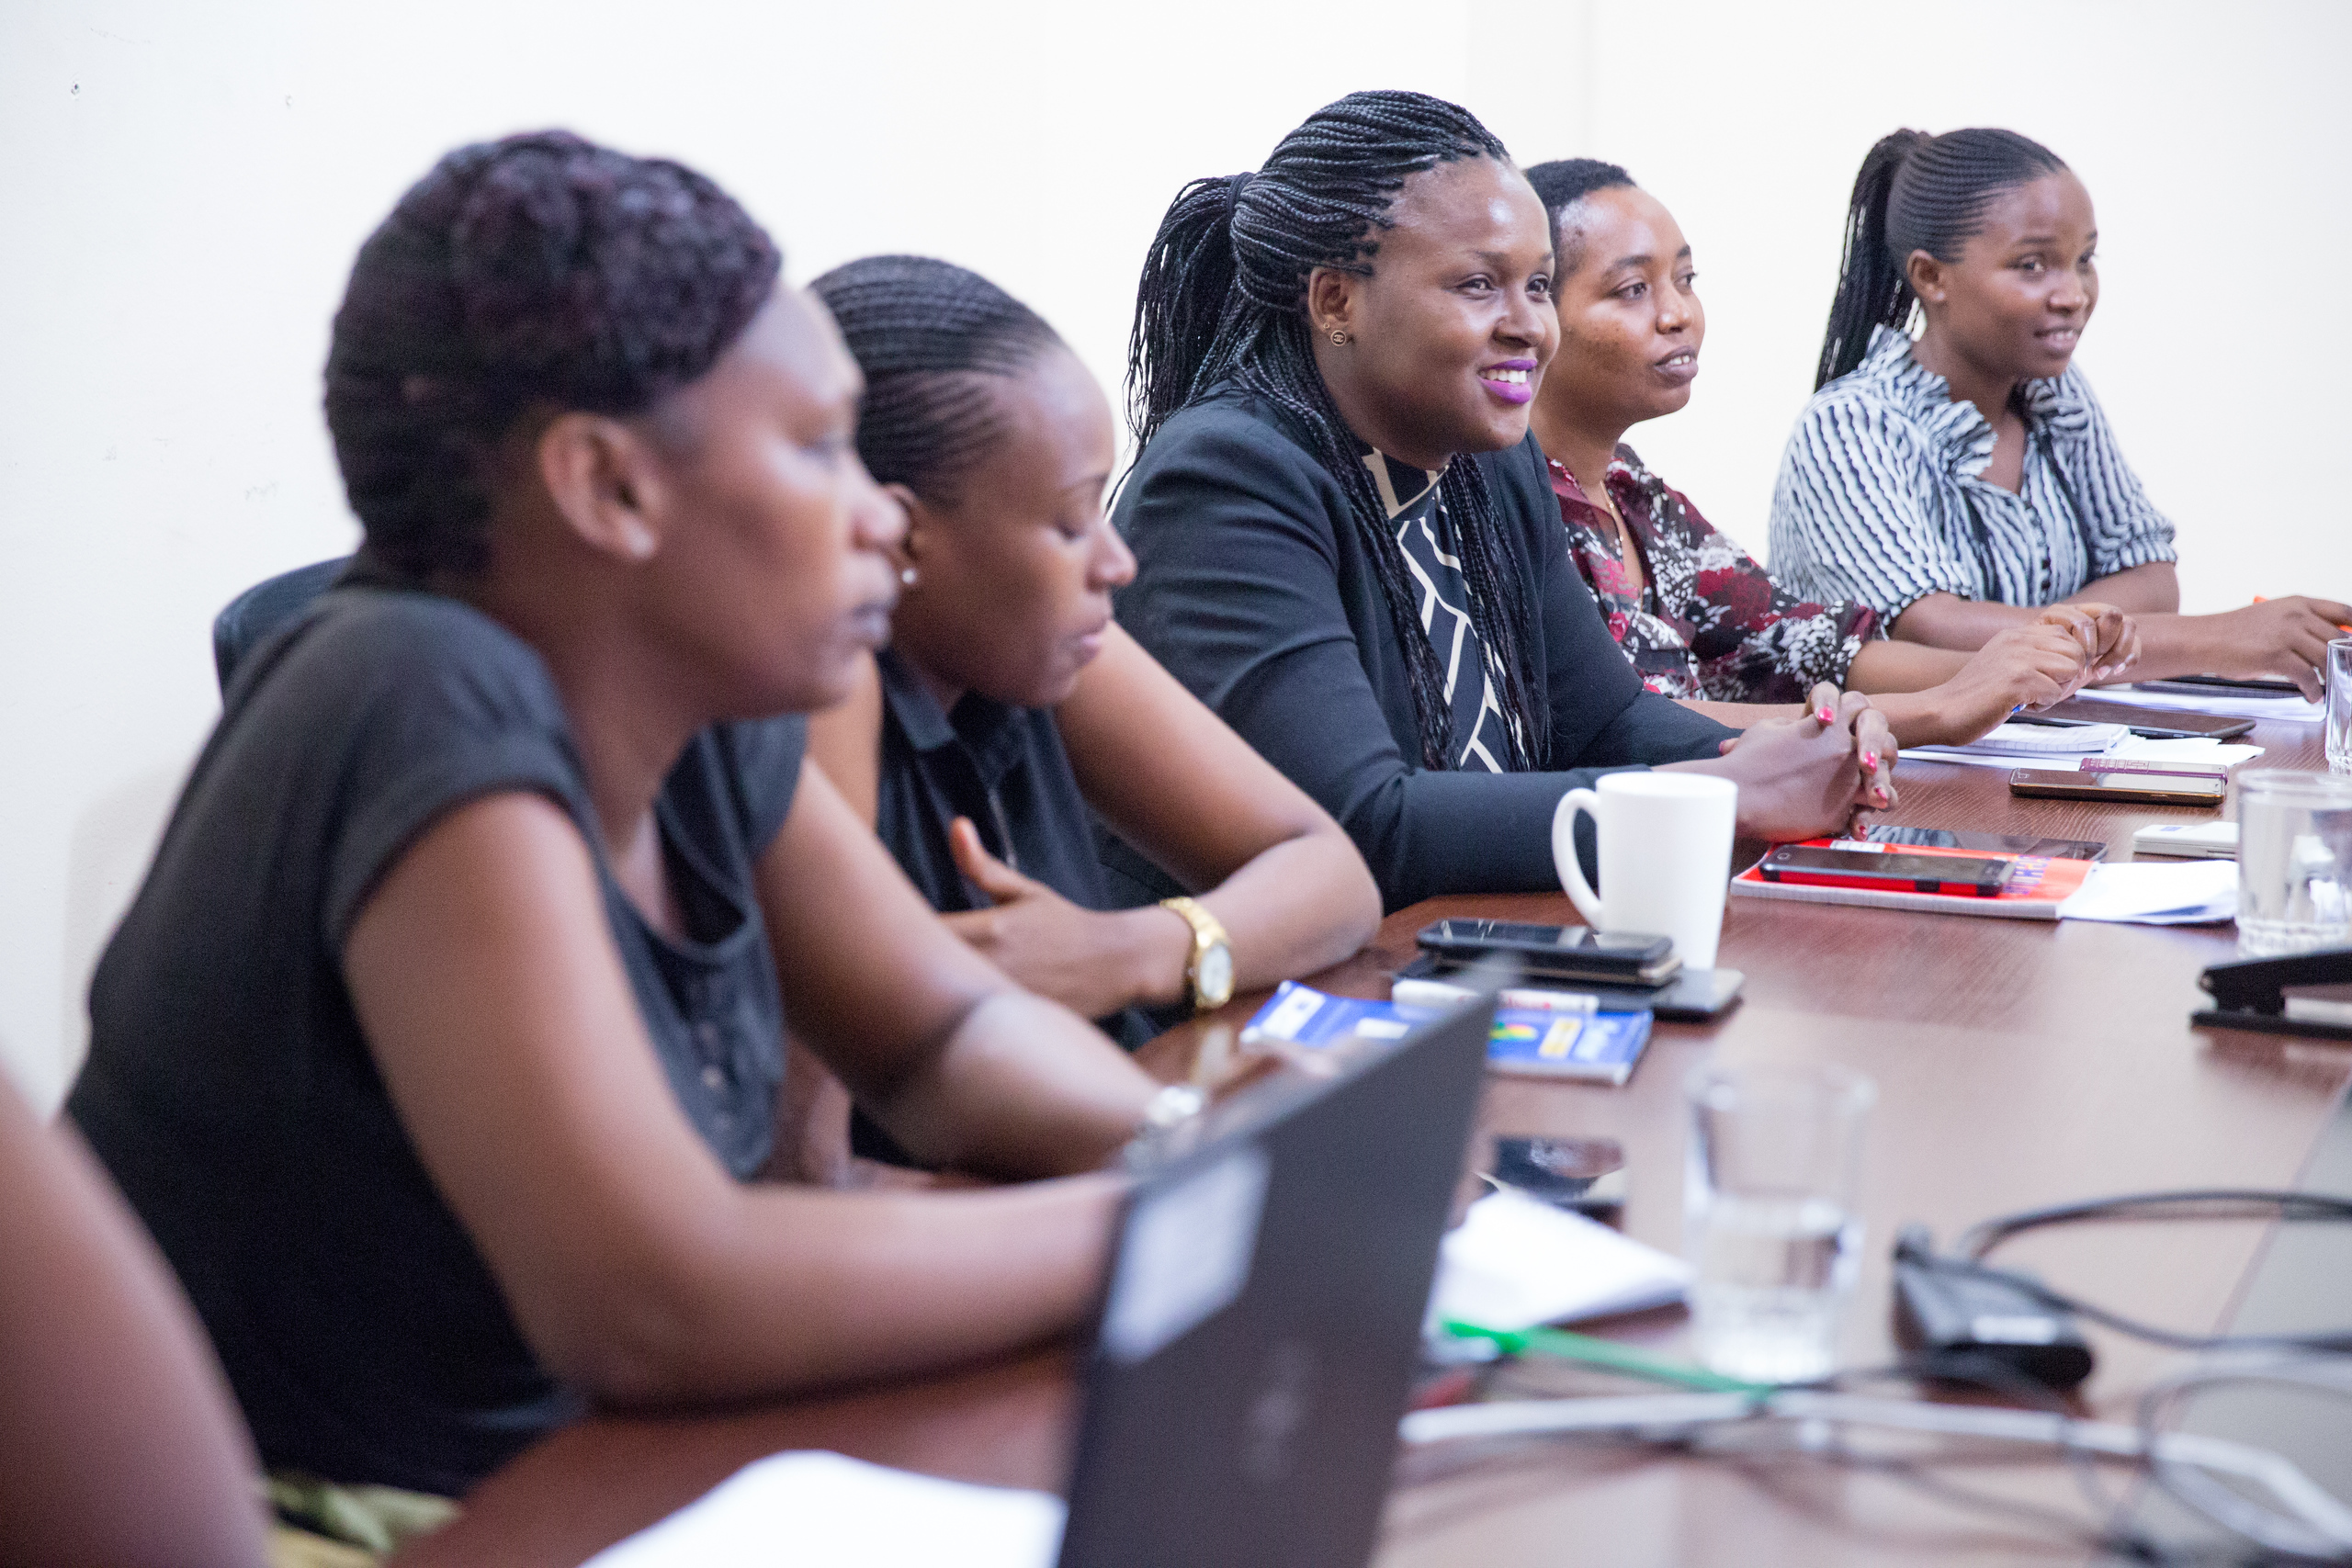
A lifelong resident of Dar es Salaam, Ritha Mboneko had received a bachelor’s degree in computer science and worked for five years as a data analyst on international development projects before she first worked with UCSF. She was brought in to work on a UCSF project for the Centers for Disease Control and Prevention, evaluating the effectiveness of a CDC-funded project to slow the spread of HIV among Tanzanian girls and young women. Mboneko worked as a data collector: She interviewed participants and coded and entered their responses using a tablet.
Global health advocates talk a lot about capacity building, by which they generally mean training local people to do work needed to advance health. But in Mboneko’s case, capacity didn’t need to be built; it just needed to be noticed.
And, before long, it was. By the time the UCSF Tanzania office was ready to launch its next major research activity, Mboneko had been hired as a field supervisor, overseeing data collectors. Mboneko also helped analyze the data and report findings.
Those first years using her data skills in the health field were exhilarating for Mboneko.
“It was really, really good because it was a new experience to me and I was also ready to learn about it,” she said. “I got to learn a lot of things that I never thought I would learn. I was trained in ethics, data collection and data supervision.”
But then COVID-19 came along, and research in Tanzania, as in everywhere else, had to adapt to reduce face-to-face contact. Mboneko and her colleagues began working on improving the quality of the HIV data that’s routinely reported.
Mboneko’s agility with data shined through. She helped establish routine analyses, adding indicators and thresholds to trigger discussions with partners to see whether there was a problem with the data or whether the data trends represented a program challenge or success.
“You can solve a big problem in the field before you even submit the data,” Mboneko said. “As we went on, we automated the data quality process to make it better.”
She explained it this way: If a clinic reports 85 patients one quarter and 75 the next, the analysis flags it so the partner can investigate. If there is a data quality challenge and not a drop in patients, the data can be corrected and 10 more people will have their medicines provided, for example. Catching errors makes reliable data available to guide public health strategies, from a given clinic up to the national ministry of health. And, Mboneko explained, Tanzanian researchers know the context and will do what it takes to find out what’s going on behind the data.
The CDC next tasked the UCSF group with verifying all HIV patients throughout the country. The data might look the same for patients who went to other clinics and for those who dropped out of treatment altogether, but successful public health strategies rely on knowing which is which.
Mboneko and her colleagues came up with something simple but functional: an automated Excel spreadsheet.
“It was a tool that could work even in remote areas where there was no Internet,” she said.
The Tanzanian Ministry of Health saw the value of this work, and soon other agencies were asking their implementing partners to verify clients. The tool Mboneko helped develop became the go-to tool for the whole effort.
The Ministry of Health also asked the UCSF team to develop an online portal where data could be uploaded, stored, analyzed, and visualized. More than 1.5 million records were submitted, and Mboneko helped review them, working with partners to purge errors. She created a data dictionary for developers to structure the database, ensuring that analyses compare apples to apples, and helped build a visualization dashboard to make trends clear to laypeople.
Having seen the power of data visualization to quickly get everyone on the same page, she began to teach herself Microsoft’s Power BI software, using YouTube videos and books.
Mboneko is now leading the development of PowerBI dashboards for several projects for the Tanzania office. According to UCSF’s Susie Welty, MPH, Mboneko is making data visualization dashboards using no-frills software “that would make some people in Silicon Valley envious.”